Reactor Simulation Software
Applications
Usable for
- mAb, protein and plasmid DNA production
- Cultivation of mammalian cell lines, insect cells, and stem cells
- Fermentation of microorganisms (like bacteria, yeasts, and fungi), plant cells and algae
- Compound mixing and storage hold
- Vaccine production
Test
- Protein refolding
- Single use bioreactors
- Perfusion reactors
- Bubble columns
- Suitable for all stirred vessel systems
Identification of
- Dead zones
- High shear zones
- Maximum temperatures
- Low/high oxygen/substrate/carbon dioxide areas
Lowering
- Energy demand
- Cell death rate
Test
- Different stirrer types and positions
- Feeding positions
- Sparger configuration and initial bubble size distributions
- Baffle and heat exchanger configuration
Increasing
- Holdup
- Product output
Results
We can adapt every aspect of the program to your needs. Talk to us about your specific simulation challenge.
Shear rate
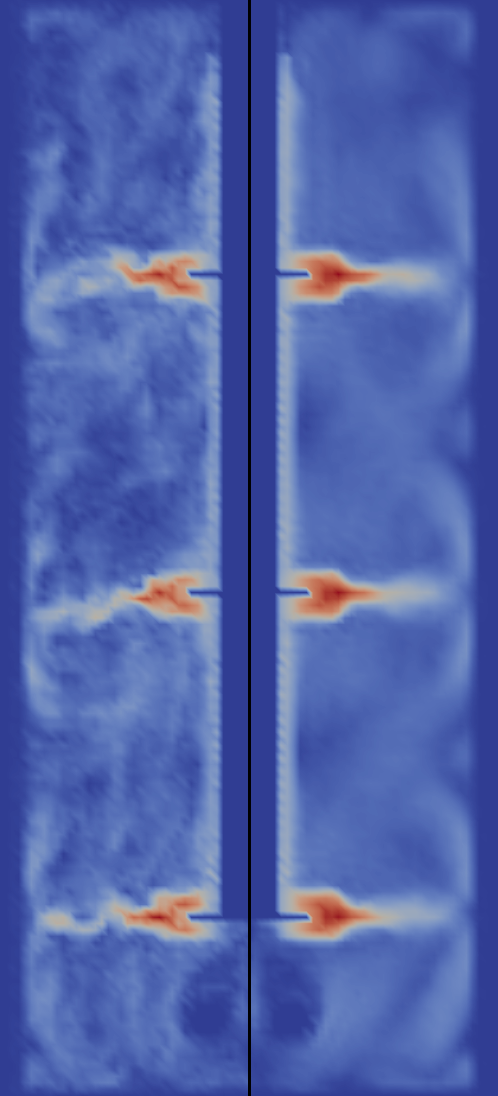
The fluid flow field reveals the shear rate, the density, pressure and the velocity for every location in the reactor at every
Mixing times
Determine mixing times with different feeding postitions and operating conditions. Enables the comparison of mixing times in reactors of different size and geometry. Find the right operating conditions to match the mixing times of your lab reactor to the production reactor.
Gas holdup
Optimize your holdup to fully use the oxygen in the spared gas bubbles. Check if bubbles depleted of oxygen exist in your reactor.
Concentration fields
The concentration of every injected species (substrate, precursor, acid, base,…), dissolved species (oxygen, carbon dioxide) or produced species (product, metabolites) can be measured for every point in the reactor. Concentration gradients can be plotted and dead zones can be identified.
Growth rates, metabolites, yield, titer
With a biological model the productivity of the reactor, including the growth rate, the metabolite production, yield and titer can be determined in silico.
Flooding
Flooding (strirrers can not distribute the gas bubbles any more) reduces the efficiency of your reactor. Detect flooding in silico.
Oxygen transmission rate
Oxygen transmission from the bubbles is tracked and the dissolved oxygen is transported through the reactor. The oxygen content of every bubble is tracked as well.
Power input
The power needed for turning the stirrer can be measured during the simulation. The power is given per axis and for each individual strirrer.
Temperature distribution
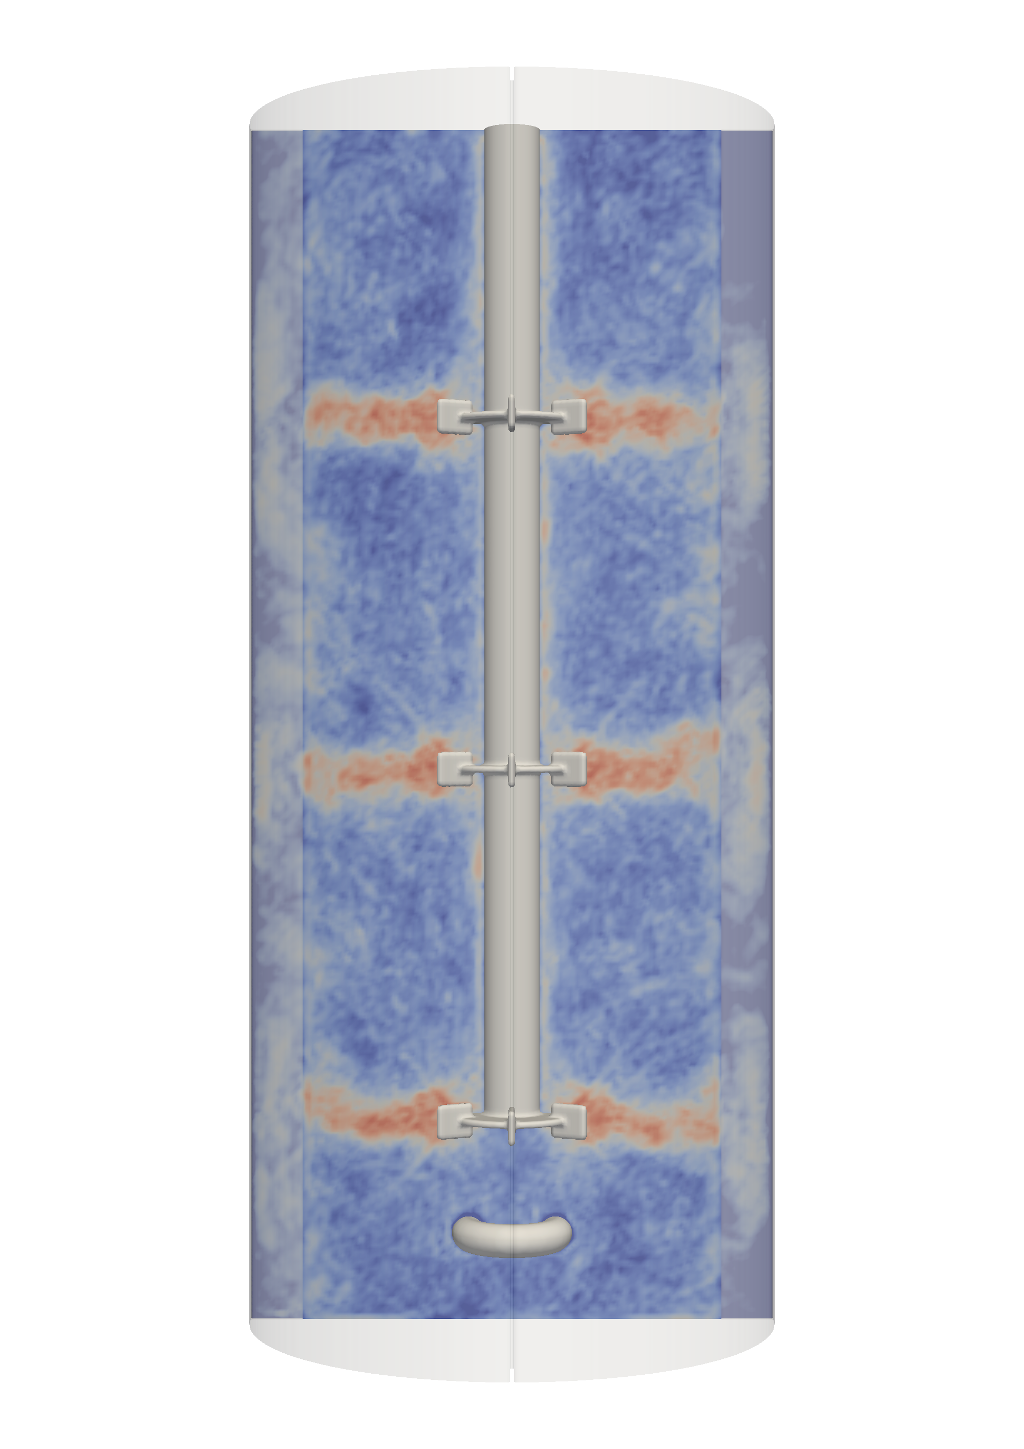
The temperature field inside the reactor is simulated for every location in the reactor. Minimum and maximum values as well as the temperatur at specific location in the reactor can be tracked during the simulation.
Oil droplet distribution
Disperged oil can be injected into the reactor as nutrient. The droplet size distribution is tracked as well as the volume fraction of the oil.
Can my reactor be simulated?
Yes, if...
- The reactor is either cylindrical or cubical with a flat or dished bottom
- The stirrer is a Rushton turbine, propeller, pitched blade, or Intermig type on a straight or tilted axis with up to five stirrers
- The gas sparger is an open pipe or a ring sprager
- The fluid shows a Newtonian or non-Newtonian behaviour
- The reactor is heated or cooled with jackets, internal tube bundle heat exchanger, by the gas bubbles or the microorganisms
- Dissolved nutrients, acids or bases are injected in the reactor or immiscible oil is added
- The reactor is operated in or near the flooded regime
- It is a single use reactor
- The reactor is a bubble column
- Top or bottom mounted sensors (e.g. pH sensor) influence the flow field
With adaption, if...
- The stirrer type is currently not included
- The form of the reactor is special (other than cylindrical or cubical)
- Large unusual installations are mounted inside the reactor
No, if...
- Large solid fractions are in the reactor
Features
Fluid flow field
The movement of the Fluid in the reactor is simulated using the lattice Boltzmann approach, which is highly efficient on graphic processing units.
Bubble movement
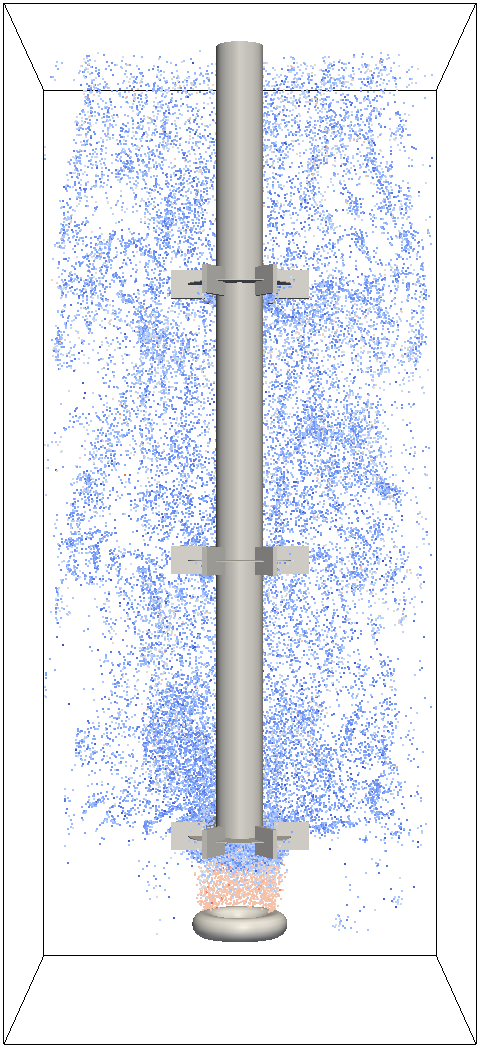
Each bubble is tracked individually in the reactor (Lagrangian method) enabling the correct prediction of the bubble size distirbution, kLa, holdup and the flooding point.
Species transport
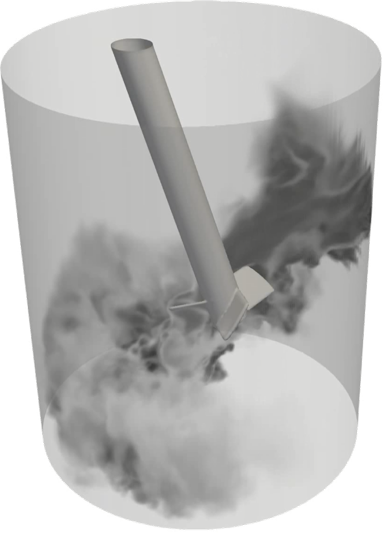
The concentration of species like nutrients, dissolved oxygen, carbon dioxide, metabolites, etc. can be tracked inside the reactor. Zones of starvation and oversupply can be determined.

Stirrer types
You can choose from a variety of stirrer types, starting with the most common Rushton to Intermig, propeller, elephant ear and pitched blade stirrers. Up to five stirrers can be defined. Talk to us about your configuration!
Mixing times
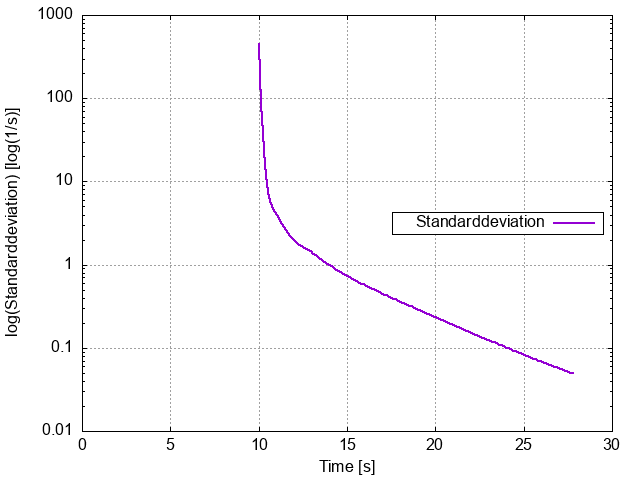
Mixing times are calculated based on the distribution of a injected tracer. The simulation can be automatically stopped if a certain degree of of homogenity (e.g. 95%) is reached.
Single-use bioreactors
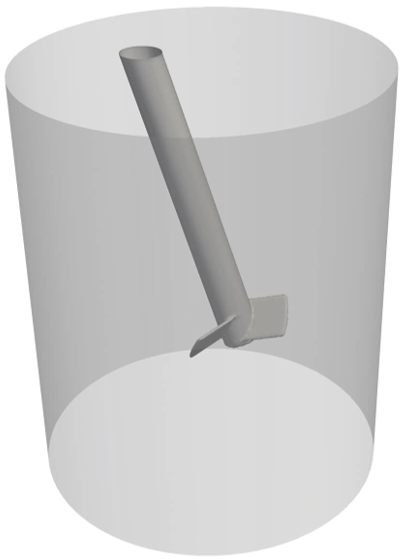
Single-use bioreactor can be simulated. The stirrer axis can be tilted, shifted and freely placed within the reactor. Hence, top, side or bottom mounted stirrer drives can be included.

Temperature distribution
The temperature inside a reactor is a crucial factor for product quality and production speed. Heating/cooling jackets and tube-bundle heat exchanger are implemented, as well as the heating and cooling by cell metabolism or by gas bubbles.
Reactor geometry
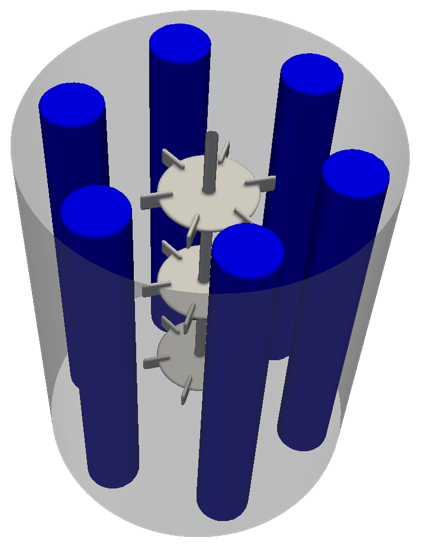
Baffle number and sizes can be defined as well as the form of the reactor bottom (flat or Klöpper head). Top mounted sensors (e.g. pH-sensor for a small reactor) can be defined as well as vertical tube heat exchanger inside the reactor.
Power consumption
The power consumption of the stirrer can be continually measured individually for every stirrer in gassed or ungassed regimes. The power consumption of every stirrer, even if they reside on the same axis, can be measured.

Shear rate distribution
The shear rate can be recorded throughout the reactor as well as the location of the maximum shear rates. Tracer particles can be introduced in the reactor to detect what shear rate the microorganisms experience on their journey through the reactor (lifelines).

Microorganisms
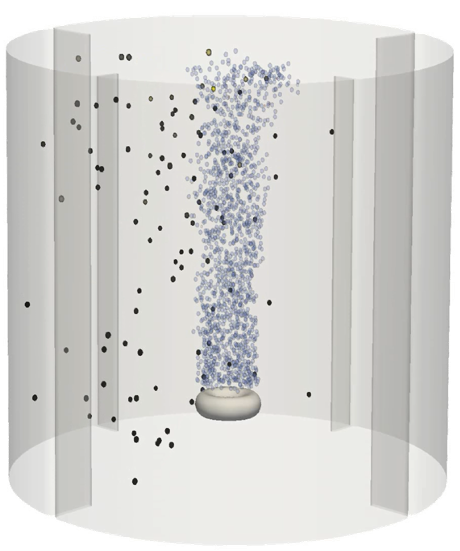
Massless tracer particles mimic the behavior of microorganisms (e.g. cells, fungal pellets, etc.). A representative number can be injected into the reactor. For those particles, the history of shear forces, nutrition concentration, temperature and production rate can be recorded (lifelines) and analysed.
Biological model
A cell based biological model can be included in the simulation. Concentrations of nutritions, metabolic products and other species as well as the history of the shear rate, starvation or oversupply can be included in the model. Simple models as the Michaelis-Menten kinetics are already included.
BYOM – Bring your own model!
Email Us
+43 681 207 931 73
SimVantage
Inffeldgasse 13
8010 Graz
Austria
